Sunday, 13 November 2016

DOW 30 - 19488 is the level to watch

The following weekly chart of  DOW 30 captures most of  the upmove since the bottom made in 2009.

I am considering two probable counts shown in red and blue, at this time. In either case it is possible that move that started from 10th Feb 2016 is a wave 5 of some degree, which may be forming an ending diagonal and may be close to completion. The broader counts will likely change if the upward trend-line of the ending diagonal shown on the chart is decisively broken to the upside.


The daily chart below shows the count for the up move that started on 10/2/16. Couple of points to note


  • Although the actual low was on 20/1/16, I am considering that the bottom was made at a higher low on 10th. The previous wave 4/iv seems to have had a 5th wave failure in wave c. This consideration brings DOW in line with SPX counts. 
  • The prices may be forming an ending diagonal. Since c is shorter than a, e has to be equal or shorter than c, since wave 3 can not be the shortest. This sets the target for completion of wave 5/3 at or below 19488. In case the prices go above that it will open new bullish possibilities.


Friday, 28 October 2016

WTI Crude

Following is the weekly chart of WTI Crude since the bottom in February 2016. There are a few points of note here

  • Move from 3 August 2016 till 19 August 2016 looks like an three wave structure. Whereas move from 20 September to 19 October looks like a 5 wave structure. As such the whole move becomes a three wave (a)-(b)-(c) corrective move.
  • The top made in October was higher than the top in June. This rules out the possibility that move from August till October may be wave 2.
  • In view of the above it seems like , the move down that started since 19 Oct 2016 may develop into an impulsive 5 wave structure to complete wave B/2.
  • The other possibility is that the prices may consolidate in a triangle which started in June 2016. Waves a and b of the triangle being over and the current move is wave c of the triangle. After which waves d and e to complete the triangle. (This is not shown on the chart)


Sunday, 11 September 2016

ASX 200 - Turned bearish

This is in continuation of the analysis done  here on 11/7/2016. I am no longer bullish on ASX 200 since 2/9/2016, when the index went below the May 2016 high of 5427. At that point the inverse head and shoulders pattern failed  Also the up move since February this year has far too many overlaps which makes me cautious to now label them as impulsive. Till indicated otherwise I am now bearish on ASX 200. Long term too many possibilities for me to take any view either bullish or bearish. 


Thursday, 18 August 2016

US Stock - AK Steel holding Corporation

Couple of observations on AKS.


  • The stock broke out from an inverse head and shoulders pattern and has fallen back to test the neckline again.
  • Price is now touching the lower trend line of the channel shown in red. 

If the price holds up here, the chart has bullish implications. The probable count in red anticipates an impulse wave up, with nested 1-2 sequence. Target to be assessed as the wave progresses. 

Alternate count in blue suggests that the ongoing up move may just be a counter trend rally in a bearish larger trend. If so, one likely target for wave c is around 8.5. At that price, A will equal C and also the target for inverse head and shoulders pattern will be met.


AUD/INR - Long term chart showing perfect Fibonacci relationships

The monthly chart below for AUD/INR analyses the wave structure since the bottom made in April 2001. The currency pair is showing perfect Fibonacci relationship since then.


  • Wave 2 retraced 61.8% of wave 1.
  • Wave 3 completed at 161.8% extension of wave 0-1.
  • Wave 4 may have completed at 50% retracement of  wave 3.


If the count shown are correct wave 5 is currently unfolding. The target for the same to be assessed as the move progresses.


Alternate possibility : It is possible that the wave labeled 3 in the above chart is actually a wave V of a higher degree, in which case the AUD/INR may have only completed first leg of correction and the downward trend will resume once counter trend rally is complete. This alternate count is shown in blue below. But till proven otherwise the count show in the chart above and also in red in chart below remains my preferred count. 


Thursday, 4 August 2016

TASI - Saudi Tadawul All share Index

This is a short post on TASI. The following chart shows the up move since the index bottomed in January of this year. The chart is showing a clear five wave pattern since then. The down move that started in April after completion of the said 5 waves up, looks like a corrective pattern which may be nearing completion. If so the prices are likely to resume the uptrend any time now. More details are on the chart.


Monday, 11 July 2016

ASX 200 - Some bullish pointers

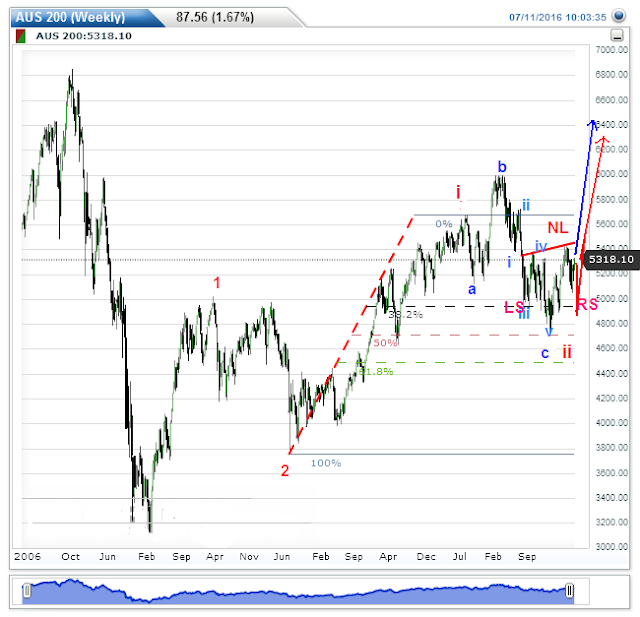
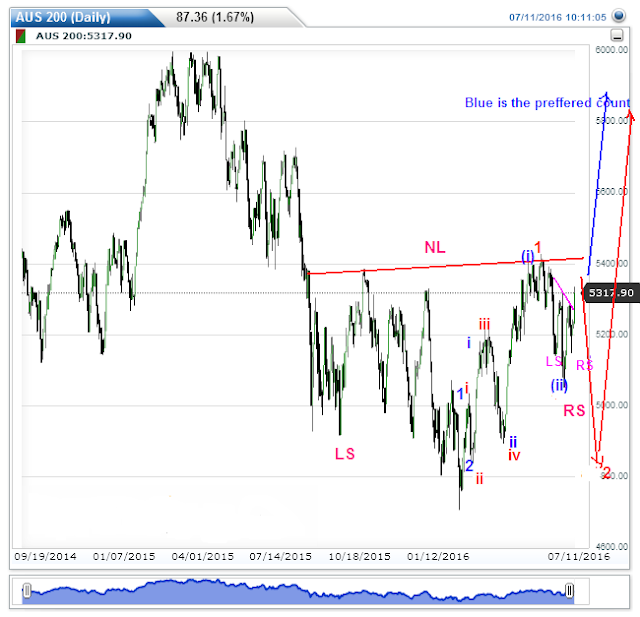
There is a possibility that Australian Index ASX 200 has formed a major bottom in February this year. Elliott wave counts and inverse head and shoulders patterns on both hourly and weekly charts support this possibility. The weekly chart below shows possible long term Elliott wave counts and an inverse head and shoulders pattern in making. The count for next wave up is not shown. Depending on the strength of the up move it may either be iii or (i) or even wave 5 of  large wave I


 The daily chart below shows the possible Elliott wave count since the bottom in February. There are two possible paths shown in blue and red, blue being the preferred one. Preference for blue count is in view of a smaller inverse head and shoulder pattern in pink (shown in more detail in hourly chart), which had a breakout today.


 The hourly chart below shows the smaller inverse head and shoulder pattern in detail.


Thursday, 7 July 2016

WTI Crude - Forming a triangle in minor degree wave 4 position?


It looks like WTI Crude may be forming a descending triangle in wave iv position. If so Crude may have one more leg up to complete wave 1/A. This count will become invalid if the price breakdown decisively below the lower line of the triangle.


Monday, 30 May 2016

USD/CNY - First phase of Bull run nearing completion?

Following is the weekly chart of USD/CNY, analyzed for the up move that started in Jan 2014. It appears like USD/CNY is making a 5 wave impulse wave pattern since then. This 5 wave pattern may be either forming wave 1 or wave A of a larger degree pattern. There is a possibility that this 5 wave pattern may be nearing completion, as per the wave counts shown. The likely targets for the completion of wave 1/A are :
  • around 6.65 - 38.2% extension of wave 0-iii
  • around 6.78 - 61.8% extension of wave 0-iii
  • around 7      - 100% extension of wave 0-iii


The important thing is that, if this analysis is correct 
  • USD/CNY is likely to start a correction soon, once this up move is complete. Likely targets between 6.65 and 7. 
  • Also the said anticipated correction is not likely to take the value below the Jan 2014 level.
  • After the anticipated correction is over, the USD/CNY is likely to resume up trend once again.

Thursday, 26 May 2016

NSE Nifty - Inverse head and shoulders breakout?

It looks like Indian Index NSE Nifty may be breaking out of a inverse head and shoulders pattern. If the pattern holds the likely target is 9200. On the Elliott Wave front the index may be making a number of nested 1,2's with 3rd of some degree 3rd likely soon.


Sunday, 1 May 2016

US Dollar Index - update

This is in continuation of the earlier post on (5/2/2016). There it was expected that the DXY will have more up move to complete wave (5). But now it appears that wave (5) might have completed as a truncated wave 5 on 21/1/2016 at 99.94.

Looking at the long term chart it appears like the prices are moving in a triangle pattern. Now going forward there seems to be two possibilities long term, as shown on the chart below shown in red and blue.

Saturday, 9 April 2016

USDJPY - Short, medium and very long term elliott wave counts

This is in continuation of the analysis done on (25/08/2015) and (16/08/2015). So far the prices have been moving as anticipated. Going forward the short and medium term possible counts are as shown on the chart below. It looks like that the USDJPY made a top with a truncated 5th wave in August 2015. Since then the currency pair is undergoing ongoing correction which looks like forming an impulse wave down. The prices may have just completed wave iii and may bounce for wave iv. Only once all 5 waves for a are complete, a meaningful rally for wave b may ensue. But the prices appear to be in bear grip in all time frames. Any upward movements look like only releif rallies. This is also seen in the very long term chart posted below as chart-2.
 

chart-1

It is interesting to see a very long term chart of the currency pair, as it shows such clear cut impulsive Elliott wave counts in a down trend since last almost 50 years. And it appears that the bear trend is not likely to be over any time soon.

chart-2

Wednesday, 2 March 2016

NSE Nifty

This is in continuation of the earlier post on NSE Nifty posted here on 11/02/016. The updated probable counts are shown on the chart below. In the previous post I was expecting a steeper wave (iii) decline. But now I am assuming wave (iii) to have completed on 12/02/2016 at 6869. As per this count index is now in wave (iv) with first likely target at around 7430. This count would become invalid if the prices go above wave i low of 7540. If correct, wave (v) down to complete wave 3 and then wave v down to complete wave 5, still remain, to complete the long term down move. Also if the index has to really complete waves 4s and 5s of various degrees, volatility may increase.


Thursday, 11 February 2016

This post on NSE Nifty is coming after a long gap. The last posts were on 3/9/201522/06/2015 and 28/02/2015.

I am now considering the price movement since the top made in January 2008 to be corrective in nature as shown in the weekly chart below. As per this, we are now in wave C of this corrective A-B-C pattern. This is a little un-orthodox count, since B overshoots the top made in January 2008 by almost 62%. But when rupee devaluation is factored in, it doesn't look all that odd. As per this count
  1. Wave a and wave c are almost equal.
  2. Wave v of c was an extended fifth wave. If true this implies correction at least till the end of wave (ii), which was around 6000.
  3. We are now in wave C which looks like an impulse wave down.


 Following daily chart show the impulse wave counts of the down move started since the top made in March 2015. Prices may now be in wave iii of some degree. If correct, this may be the steepest phase of correction. Once iii is complete prices may gradually move down to complete remaining waves of various degrees.

Friday, 5 February 2016

US Dollar Index

Following is the weekly chart of  US Dollar Index starting at the bottom made in April 2011, showing one of the probable wave counts (my preferred count). As explained on the chart also, the following is observed if counted as shown:
  • Wave 2 was about 50% of wave 1
  • Wave 4 was about 38% of wave 3.
  • Wave i is taken to be sub dividing and taken to be longest wave of wave 1. Wave iii and wave v are equal. Counting this way, wave 3 is not the shortest of 5 waves comprising wave 1, nor does the sub-waves of wave iii overlap. 


Tuesday, 26 January 2016

Russian Index - RTSI

Following is the weekly chart of Russia's main index RTSI. As shown on the chart the down move started from the top made in April 2011 may be a three wave corrective pattern (a-b-c), with c wave decline having started all the way back in October 013. The index may currently be in the wave (v) of this wave c, where it may be forming an ending diagonal pattern.

It is to note that RSX (market vectors Russia ETF) is also showing similar counts.


However, this is only a possibility, looking at the chart pattern till date. The Index remains in a downward trend for now and the future price action may invalidate this wave count.


Sunday, 17 January 2016

Two ETFs - EEM (Emerging Markets) and EWA (Australia)

This post analyses iShares MSCI Emerging markets ETF and iShares MSCI Australia ETF. The probable count shows the possibility that the down trend that started from May 2011 for EEM and  April 2010 for EWA may be nearing completion. Of the two ETF's EEM is showing clearer counts. EWA may still be in wave iii and may have another leg down as an alternate count. However the probability of a change in trend calls for caution with shorts.


EEM


EWA
 

Copper - Another channel, another long term trend line

This is in continuation of my earlier post on Copper, posted here on 12/10/2015.  As it happened, August low was broken and the detailed wave counts shown there for wave C became invalid. However I am still going with the long term A-B-C corrective wave count starting May 2006. The detailed count for wave C has however changed as shown in the chart below.