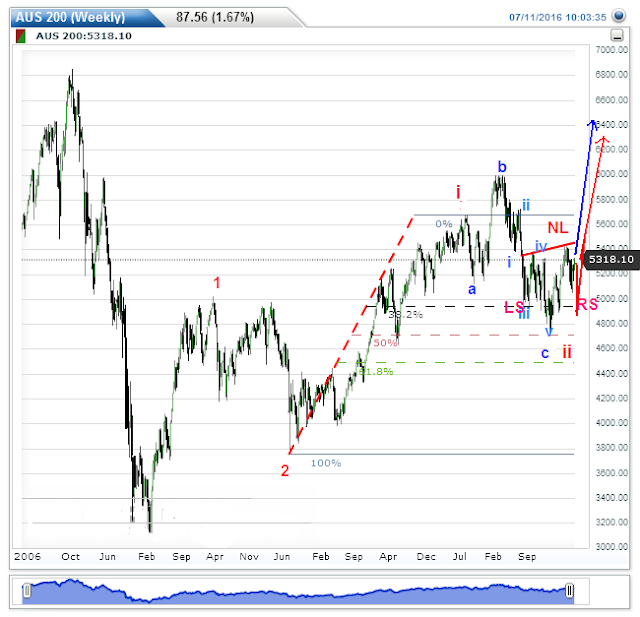
There is a possibility that Australian Index ASX 200 has formed a major bottom in February this year. Elliott wave counts and inverse head and shoulders patterns on both hourly and weekly charts support this possibility. The weekly chart below shows possible long term Elliott wave counts and an inverse head and shoulders pattern in making. The count for next wave up is not shown. Depending on the strength of the up move it may either be iii or (i) or even wave 5 of large wave I.
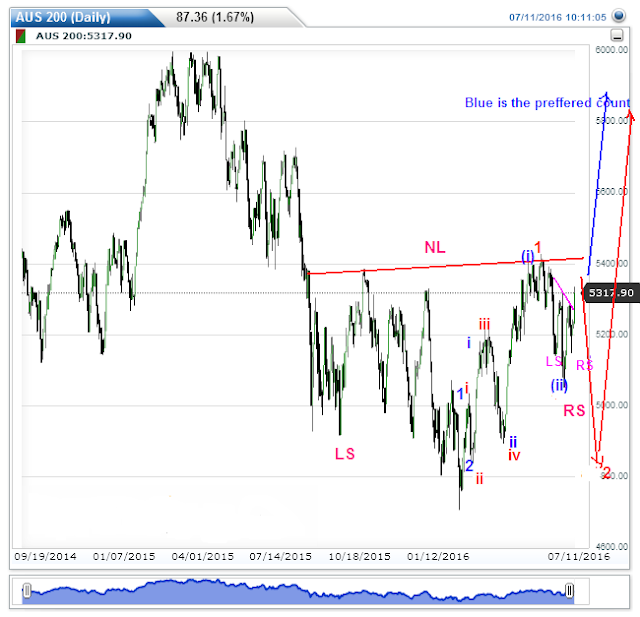
The daily chart below shows the possible Elliott wave count since the bottom in February. There are two possible paths shown in blue and red, blue being the preferred one. Preference for blue count is in view of a smaller inverse head and shoulder pattern in pink (shown in more detail in hourly chart), which had a breakout today.
The hourly chart below shows the smaller inverse head and shoulder pattern in detail.


