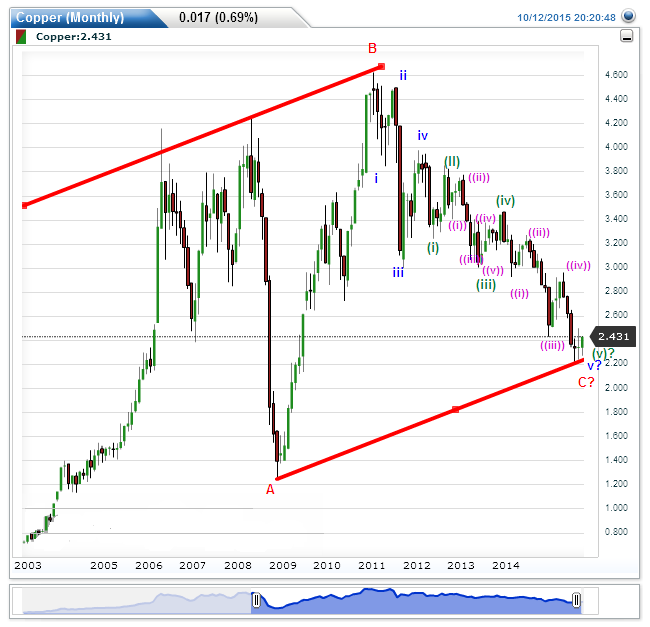
The monthly chart of Copper shows that the prices are touching the lower trend line of the channel formed since the top made in May 2008. It is probable that copper may have made a long term bottom in August this year. If the counts shown in the following chart prove to be correct, then it would imply that
- Copper has just completed an irregular flat correction.
- The fifth of C is an extended fifth
- The fifth of fifth of C is also an extended fifth
This count will be invalid if the price drops below the August lows.